
Vancouver Island Market Report Infographics
INFOGRAPHICS: May 2026 VIREB Vancouver Island Market Reports

BUYERS CAUTIOUS, BUT WELL-PRICED HOMES ARE STILL MOVING
The Vancouver Island Real Estate Board (VIREB) recorded 768 unit sales (all property types) in May 2026, down one per cent from one year ago. Year-over-year active listings (all property types) were 4,585, up three per cent from the previous year.
In the single-family category (excluding acreage and waterfront), 384 homes sold in May 2026, down four per cent from one year ago and an increase of three per cent from April 2026. Sales of condo apartments last month came in at 79, increasing by 10 per cent year over year and 23 per cent from April. In the row/townhouse category, 113 units changed hands in May, up 33 per cent from one year ago and 28 per cent from April.
Active listings of single-family homes were 1,529 in May, down from 1,565 one year ago. VIREB’s inventory of condo apartments was 386 last month, down from the 399 properties listed in May 2025. There were 370 row/townhouses for sale last month compared to 346 the previous year.
“Consumer confidence has been affected by ongoing uncertainty, and many buyers appear to be taking a more cautious, wait-and-see approach before making a decision to purchase,” said Jason Yochim, VIREB Chief Executive Officer.
Read the full report on VIREB website!
The following data is a comparison between May 2026 and May 2025 numbers, and is current as of June 2026. Click here to check out last month’s infographics.
You can also view all our VIREB infographics by clicking here.
Download Printable Version – May 2026 VIREB Market Report

INFOGRAPHICS: April 2026 VIREB Vancouver Island Market Reports
SPRING MARKET AWAKENS WITH LATE-APRIL UPTICK
The Vancouver Island Real Estate Board (VIREB) recorded 683 unit sales (all property types) in April 2026, down 12 per cent from one year ago. Year-over-year active listings (all property types) were 4,256, up four per cent from the previous year.
In the single-family category (excluding acreage and waterfront), 372 homes sold in April 2026, down six per cent from one year ago and an increase of 23 per cent from March 2026. Sales of condo apartments last month came in at 64, decreasing by 33 per cent year over year and down 11 per cent from March. In the row/townhouse category, 88 units changed hands in April, down one per cent from one year ago and up 24 per cent from March.
Active listings of single-family homes were 1,399 in April, up from 1,362 one year ago. VIREB’s inventory of condo apartments was 374 last month, down from the 410 properties listed in April 2025. There were 383 row/townhouses for sale last month compared to 331 the previous year.
“While the spring market is a little slow getting underway this year, activity picked up in the latter half of April,” said Jason Yochim, Chief Executive Officer. “We’re seeing signs that momentum is building, and that could translate into a busier May as more buyers re-engage.”
Read the full report on VIREB website!
The following data is a comparison between April 2026 and April 2025 numbers, and is current as of May 2026. Click here to check out last month’s infographics.
You can also view all our VIREB infographics by clicking here.
Download Printable Version – April 2026 VIREB Market Report

INFOGRAPHICS: March 2026 VIREB Vancouver Island Market Reports
BALANCED MARKET, MEASURED MOMENTUM IN MARCH
he Vancouver Island Real Estate Board (VIREB) recorded 636 unit sales (all property types) in March 2026, up one per cent from one year ago. Year-over-year active listings (all property types) were 3,776, up two per cent from the previous year.
In the single-family category (excluding acreage and waterfront), 302 homes sold in March 2026, up two per cent from one year ago and an increase of 32 per cent from February 2026. Sales of condo apartments last month came in at 72, decreasing by 15 per cent year over year and up 53 per cent from February. In the row/townhouse category, 71 units changed hands in March, down three per cent from one year ago and up 29 per cent from February.
Active listings of single-family homes were 1,193 in March, up from 1,162 one year ago. VIREB’s inventory of condo apartments was 363 last month, down from the 408 properties listed in March 2025. There were 333 row/townhouses for sale last month compared to 317 the previous year.
Read the full report on VIREB website!
The following data is a comparison between March 2026 and March 2025 numbers, and is current as of April 2026. Click here to check out last month’s infographics.
You can also view all our VIREB infographics by clicking here.
Download Printable Version – March 2026 VIREB Market Report

INFOGRAPHICS: February 2026 VIREB Vancouver Island Market Reports
FEBRUARY SALES REBOUND AS SPRING APPROACHES
The Vancouver Island Real Estate Board (VIREB) recorded 465 unit sales (all property types) in February 2026, down three per cent from one year ago. Year-over-year active listings (all property types) were 3,360, up four per cent from the previous year.
In the single-family category (excluding acreage and waterfront), 228 homes sold in February 2026, down three per cent from one year ago and up 78 per cent from January 2026. Sales of condo apartments last month came in at 47, decreasing by 19 per cent year over year and 11 per cent from January. In the row/townhouse category, 55 units changed hands in February, down eight per cent from one year ago and the same number as in January.
Active listings of single-family homes were 988 in February, up from 975 one year ago. VIREB’s inventory of condo apartments was 327 last month, down from the 376 properties listed in February 2025. There were 302 row/townhouses for sale last month compared to 245 the previous year.
“February saw single-family home sales rebound after a January led by strong condo apartment and row/townhouse activity,” said Jason Yochim, Chief Executive Officer. “While it’s too early to call this a trend, it suggests buyers are active across property types as we head into spring.”
Read the full report on VIREB website!
The following data is a comparison between February 2026 and February 2025 numbers, and is current as of March 2026. Click here to check out last month’s infographics.
You can also view all our VIREB infographics by clicking here.
Download Printable Version – February 2026 VIREB Market Report

INFOGRAPHICS: January 2026 VIREB Vancouver Island Market Reports
MULTI-FAMILY MOMENTUM BALANCES SLOWER SINGLE-FAMILY SALES
The Vancouver Island Real Estate Board (VIREB) recorded 388 unit sales (all property types) in January 2026, down 10 per cent from one year ago. Year-over-year active listings (all property types) were 3,157, up six per cent from the previous year.
In the single-family category (excluding acreage and waterfront), 162 homes sold in January 2026, down 19 per cent from one year ago and 25 per cent from December 2025. Sales of condo apartments last month came in at 53, increasing by 15 per cent year over year and 43 per cent from December.
In the row/townhouse category, 55 units changed hands in January, up 28 per cent from one year ago and 17
per cent from December. Active listings of single-family homes were 895 in January, up from 888 one year ago. VIREB’s inventory of condo apartments was 310 last month, an increase from the 293 properties listed in January 2025.
There were 277 row/townhouses for sale last month compared to 219 the previous year. “The market got off to a slow start in January on the single-family side, but that was offset by strong activity in condo apartments and row/townhouses,” says Jason Yochim, VIREB Chief Executive Officer. “Looking ahead, the overall forecast suggests a year that closely resembles 2025 in terms of sales, which points to a relatively stable market.”
Read the full report on VIREB website!
The following data is a comparison between January 2026 and January 2025 numbers, and is current as of February 2026. Click here to check out last month’s infographics.
You can also view all our VIREB infographics by clicking here.
Download Printable Version – January 2026 VIREB Market Report

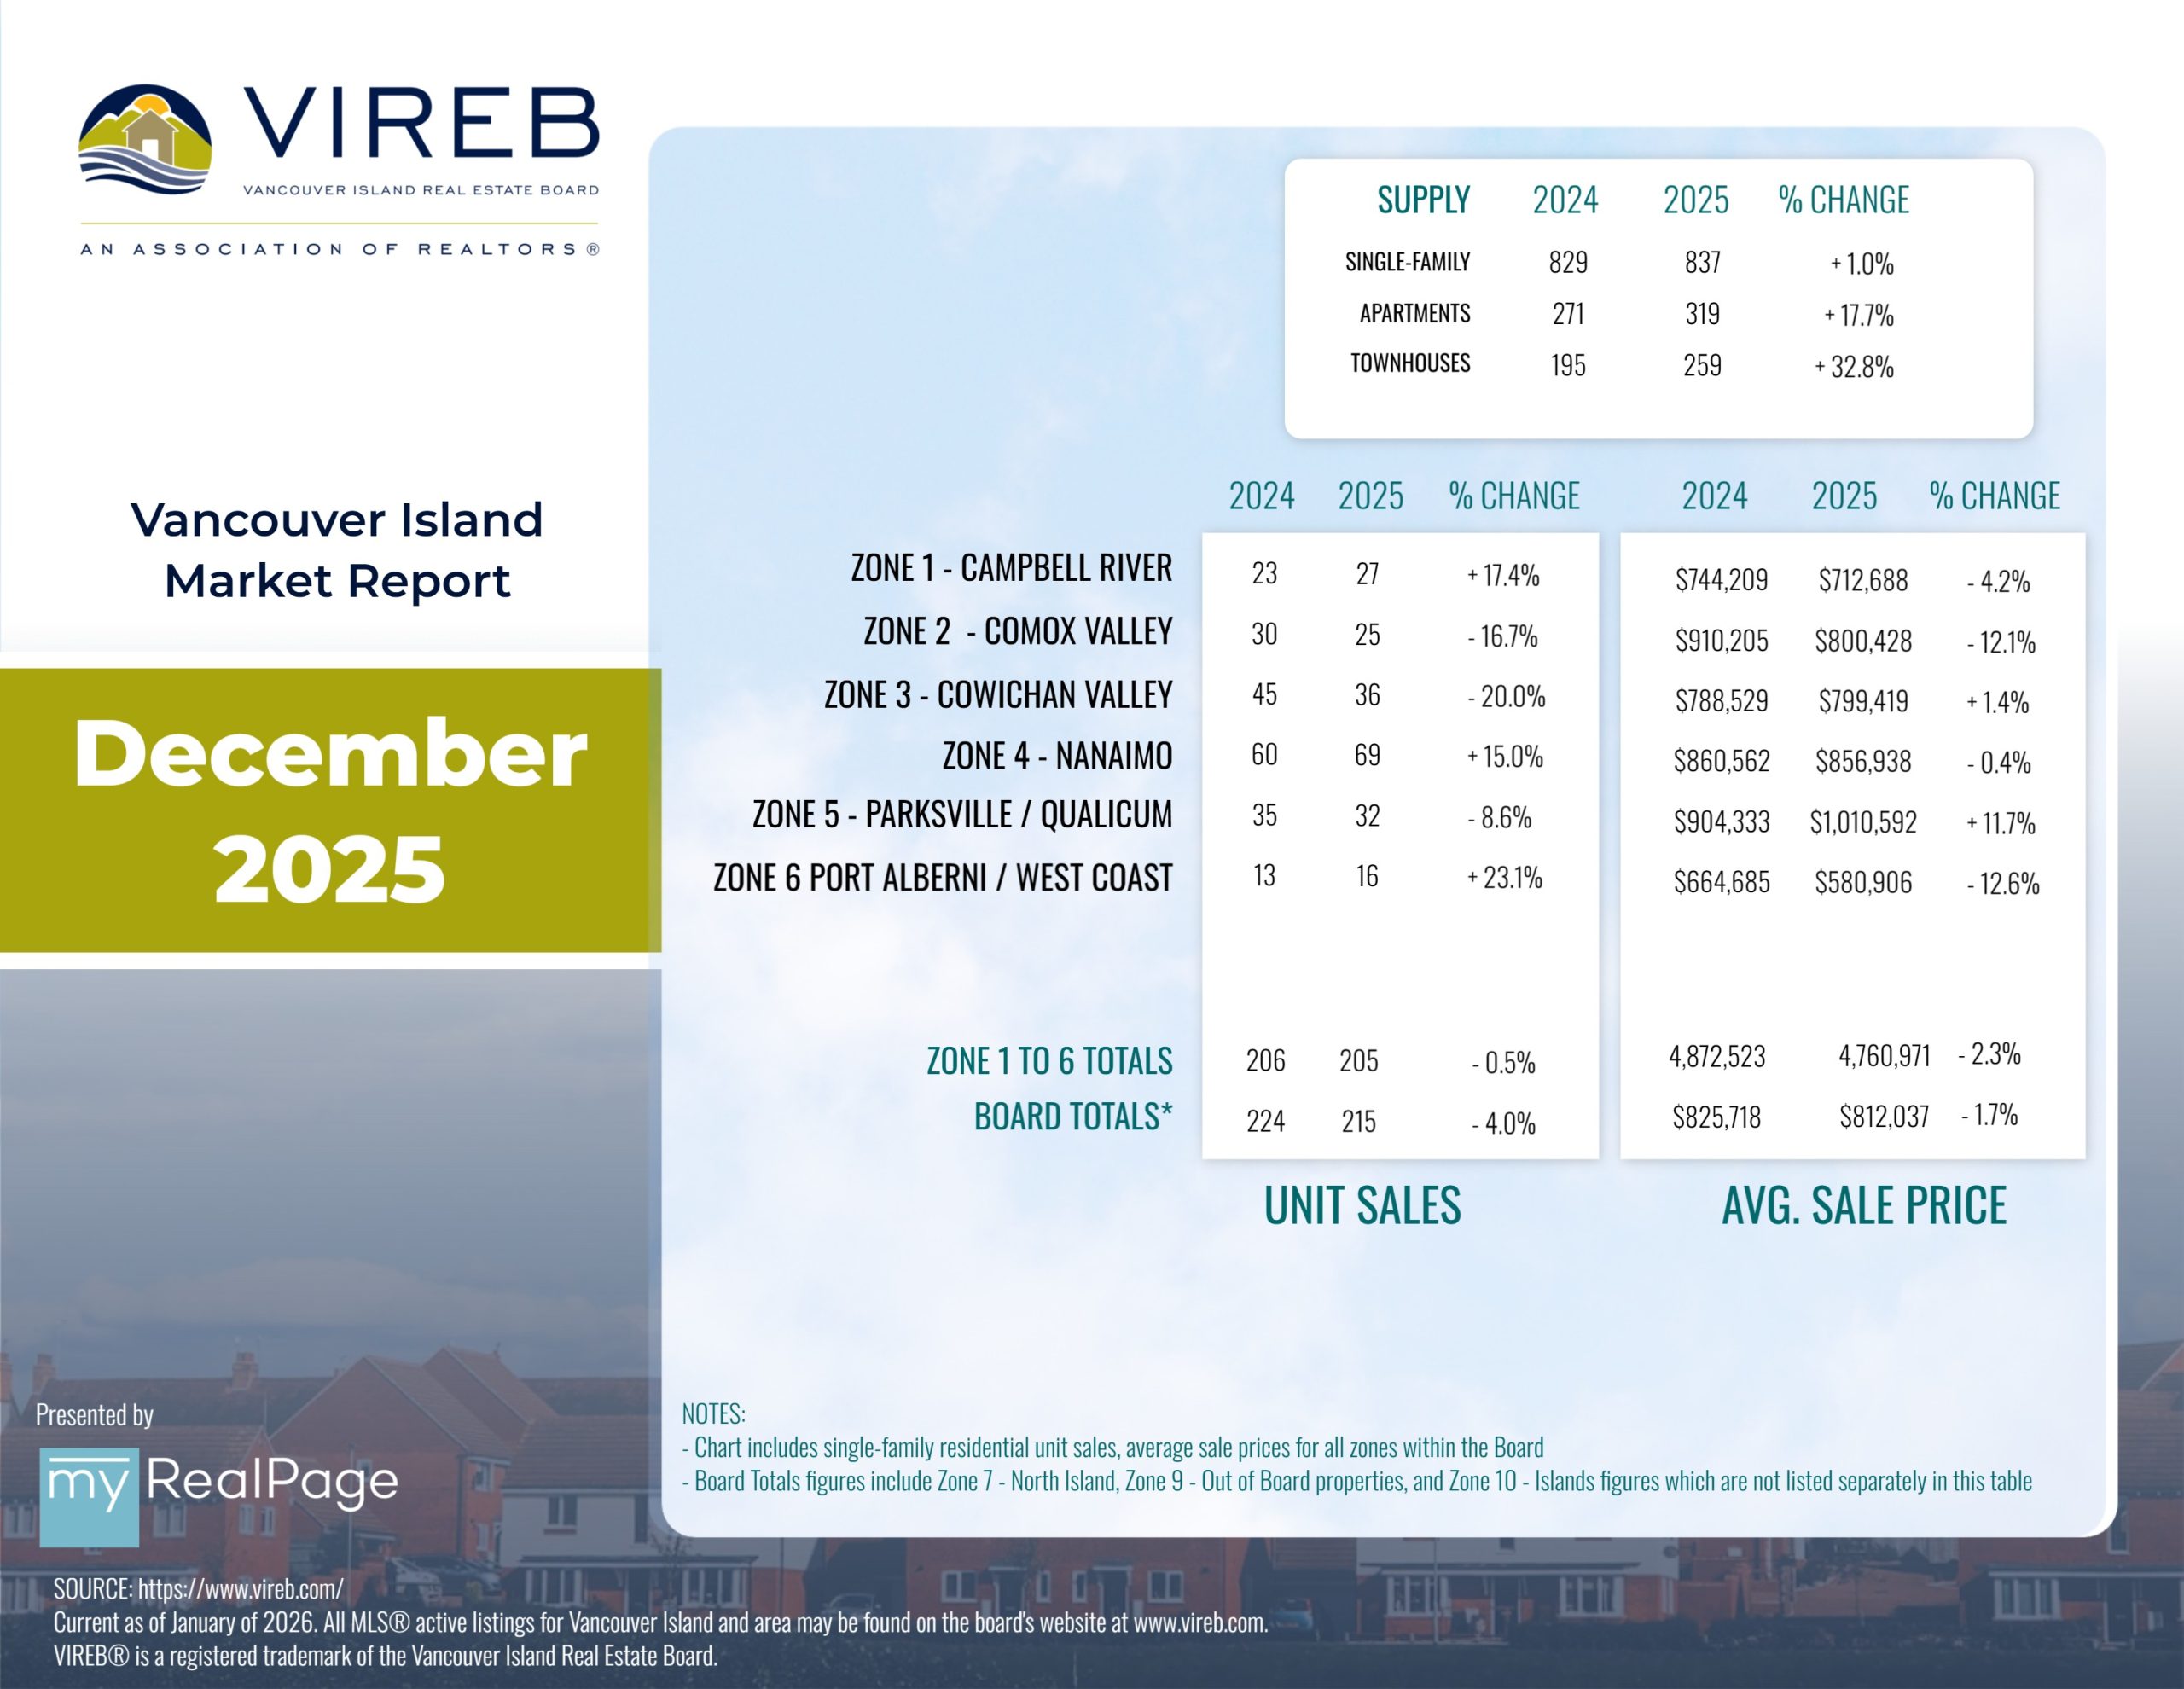
INFOGRAPHICS: December 2025 VIREB Vancouver Island Market Reports
ONE WORD DEFINED VIREB’S HOUSING MARKET IN 2025: RESILIENCE
The Vancouver Island Real Estate Board (VIREB) recorded 7,620 unit sales (all property types) in 2025 compared to 7,473 in 2024. There were 412 unit sales in December 2025, down six per cent from one year ago. Active listings last month were 3,075, up seven per cent year over year.
In the single-family category (excluding acreage and waterfront), 215 homes sold in December, down four per cent from one year ago and 17 per cent from November. Sales of condo apartments last month came in at 37, decreasing by 16 per cent year over year and down 26 per cent from November. In the row/townhouse category, 47 units changed hands in December, down 18 per cent from one year ago and 11 per cent from November.
Active listings of single-family homes were 837 in December, up from 829 one year ago. VIREB’s inventory of condo apartments was 319 last month, increasing from the 271 properties listed in December 2024. There were 259 row/townhouses for sale last month compared to 195 the previous year.
Despite early economic headwinds in 2025, including inflation concerns and uncertainty around global trade, VIREB’s housing market proved notably resilient, particularly when compared with conditions in Vancouver and the Lower Mainland. While some volatility occurred, the overall economic fallout was less severe than expected, allowing the VIREB market to close the year with modest growth.
“If there’s one word that defines our 2025 housing market, it’s resilience,” says VIREB CEO Jason Yochim.
“We began the year bracing for economic disruption, from global trade tensions to lingering inflation,
but the impact was far less dramatic than many feared.”
Read the full report on VIREB website!
The following data is a comparison between December 2025 and December 2024 numbers, and is current as of December of 2025. Click here to check out last month’s infographics.
You can also view all our VIREB infographics by clicking here.
Download Printable Version – December 2025 VIREB Market Report
INFOGRAPHICS: November 2025 VIREB Vancouver Island Market Reports
CONTINUED STABILITY REFLECTS CONFIDENCE IN HOUSING MARKET
The Vancouver Island Real Estate Board (VIREB) recorded 513 unit sales (all property types) in November 2025, down eight per cent from one year ago. Year-over-year active listings (all property types) were 3,646, up five per cent from the previous year.
In the single-family category (excluding acreage and waterfront), 259 homes sold in November, down one per cent from one year ago and 18 per cent from October. Sales of condo apartments last month came in at 50, a decrease of 19 per cent year over year and a drop of 28 per cent from October. In the row/townhouse category, 53 units changed hands in November, down 29 per cent from one year ago and 32 per cent from October.
Active listings of single-family homes were 1,121 last month compared to 1,105 in November 2024. VIREB’s inventory of condo apartments was 346 in November, down from the 314 listings posted one year ago. There were 310 row/townhouses for sale last month compared to 257 in November 2024.
“VIREB’s housing market remains relatively stable, with sales sitting just below the ten-year average and conditions at the high end of balanced territory,” says VIREB CEO Jason Yochim. “Although sales of single-family homes, condo apartments, and row/townhouses dipped in November, that’s typical for this time of year as buyers and sellers slow down for the holidays.”
Read the full report on VIREB website!
The following data is a comparison between November 2025 and November 2024 numbers, and is current as of December of 2025. Click here to check out last month’s infographics.
You can also view all our VIREB infographics by clicking here.
Download Printable Version – November 2025 VIREB Market Report

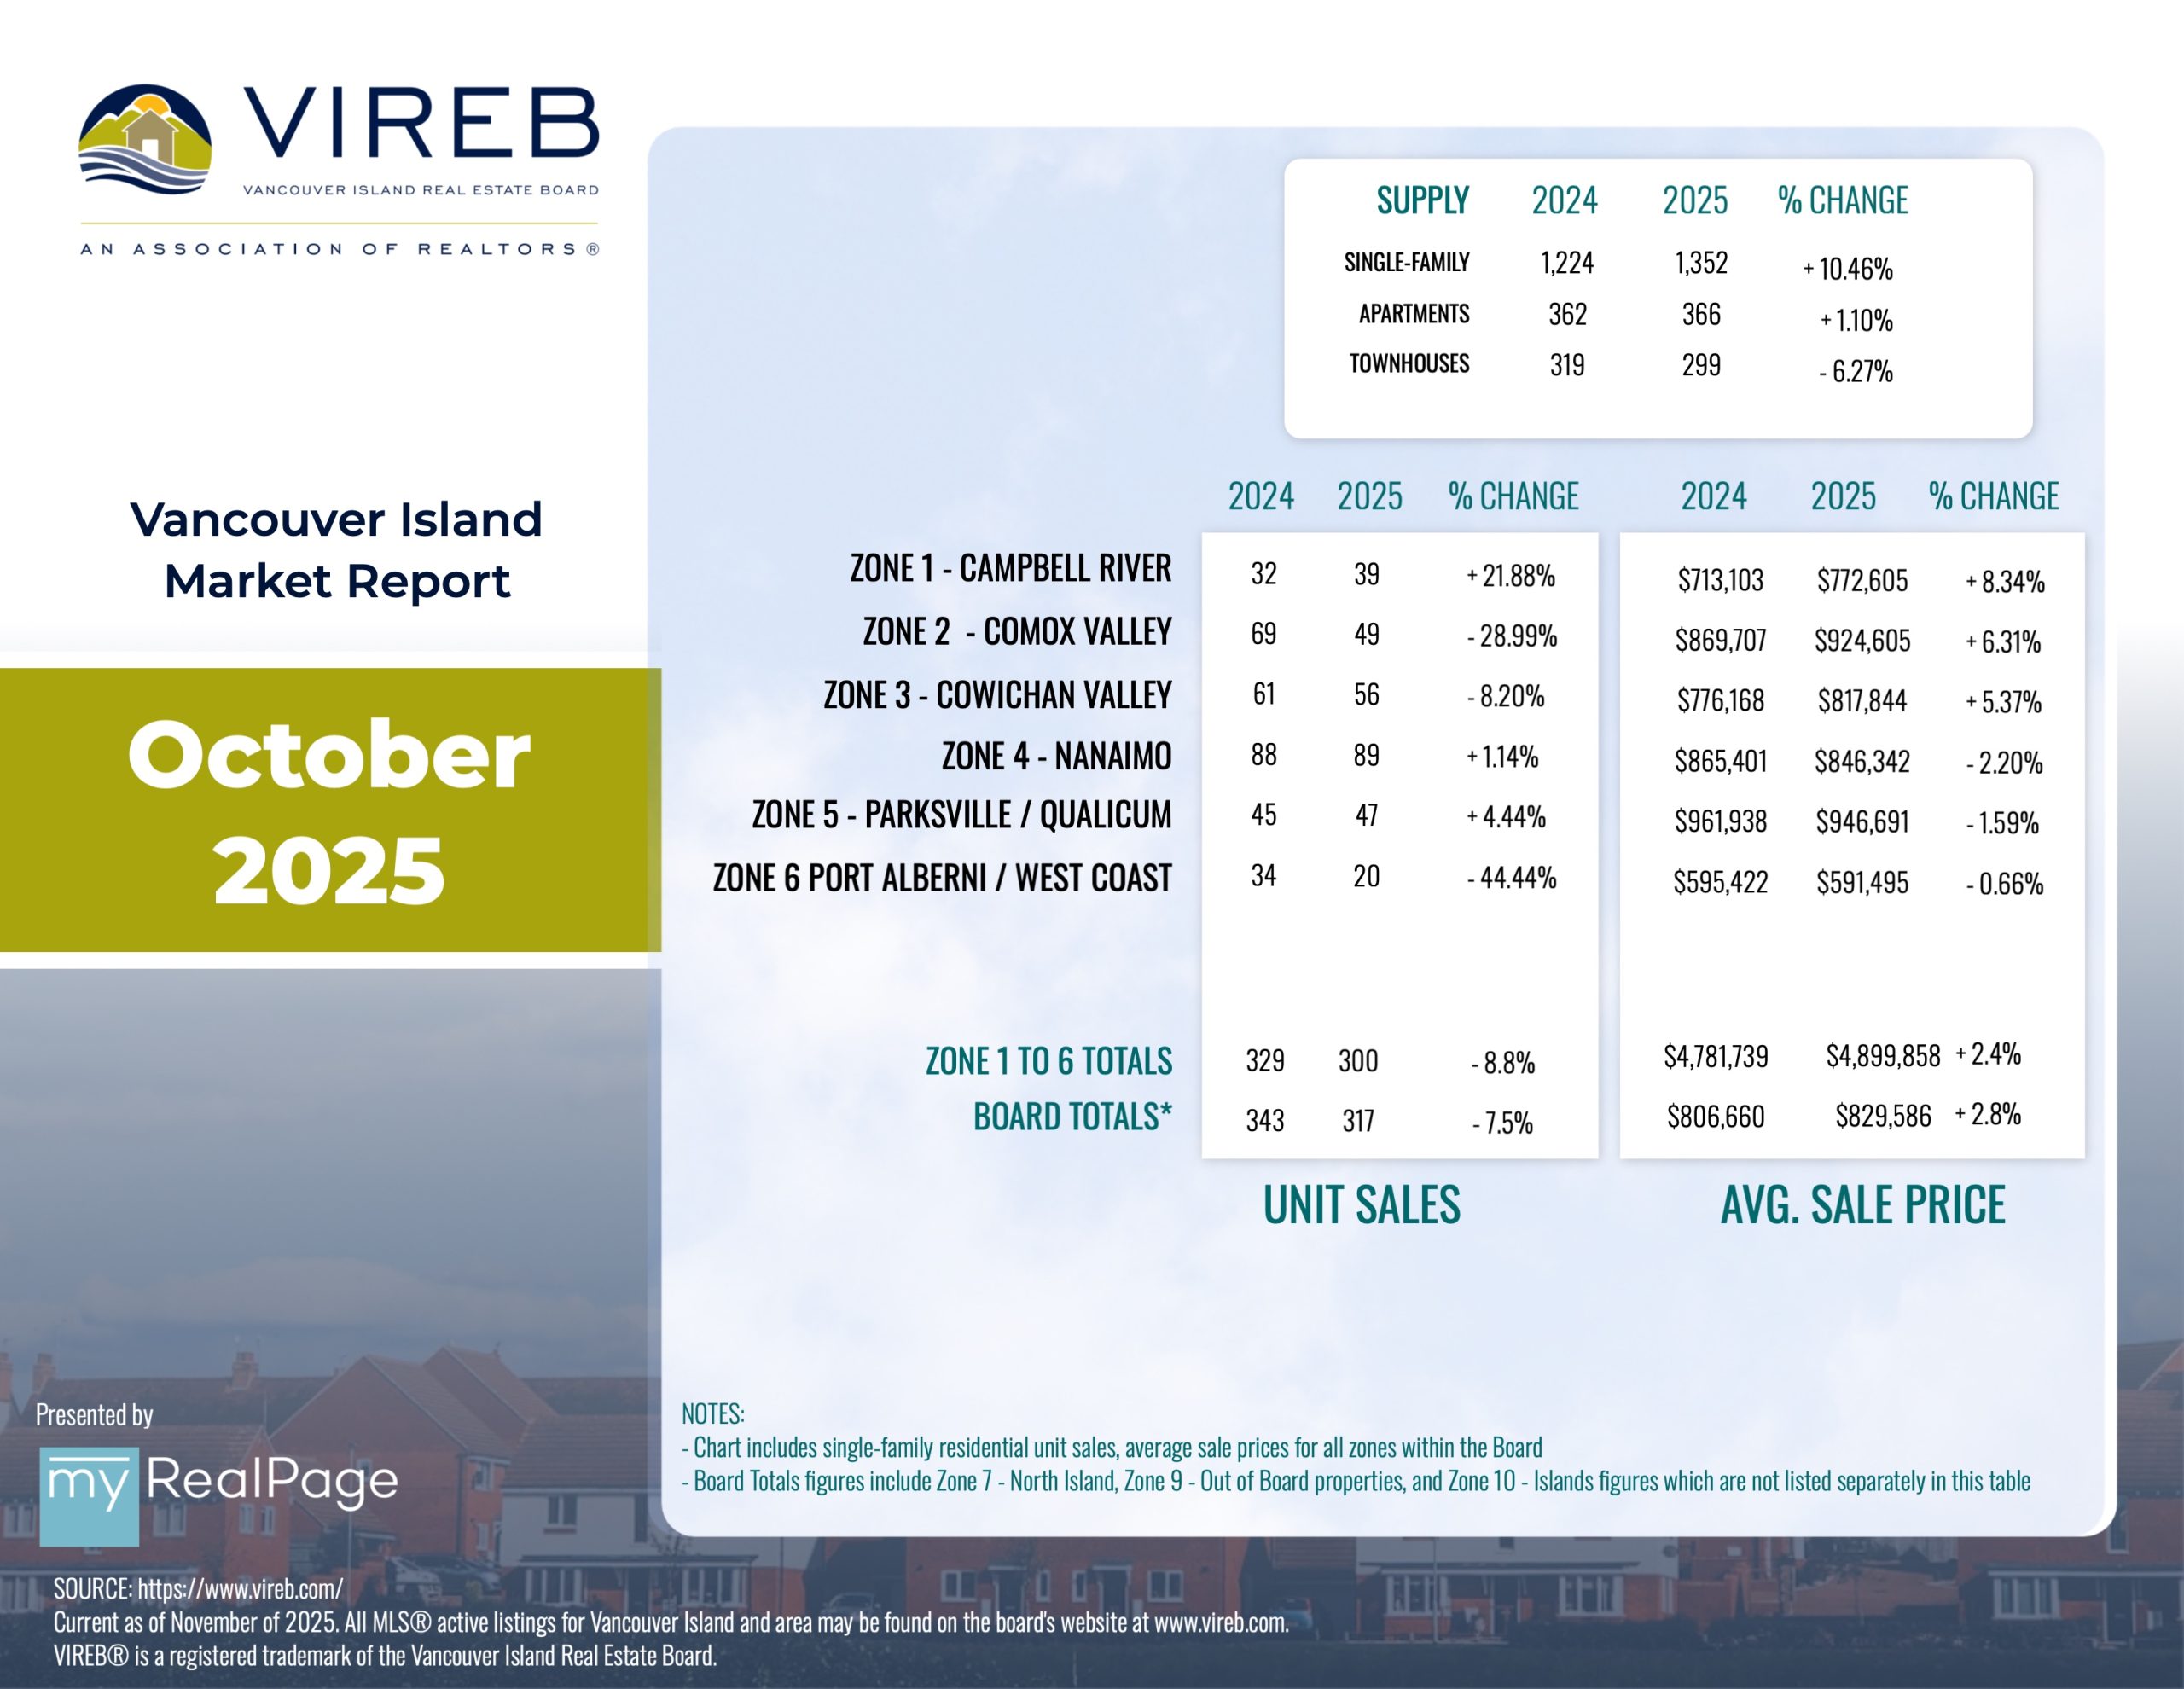
INFOGRAPHICS: October 2025 VIREB Vancouver Island Market Reports
BALANCED CONDITIONS DEFINE LOCAL HOUSING MARKET THIS FALL
The Vancouver Island Real Estate Board (VIREB) recorded 649 unit sales (all property types) in October 2025, down nine per cent from one year ago. Year-over-year active listings (all property types) were 3,838, down four per cent from the previous year.
In the single-family category (excluding acreage and waterfront), 317 homes sold in October, down eight per cent from one year ago and up three per cent from September. Sales of condo apartments last month came in at 69, a decrease of 13 per cent year over year and up by 17 per cent from September. In the row/townhouse category, 78 units changed hands in October, down six per cent from one year ago and one per cent from September.
Active listings of single-family homes were 1,224 last month compared to 1,352 in October 2024. VIREB’s inventory of condo apartments was 362 in October, down from the 366 listings posted one year ago. There were 319 row/townhouses for sale last month compared to 299 in October 2024.
Read the full report on VIREB website!
The following data is a comparison between October 2025 and October 2024 numbers, and is current as of November of 2025. Click here to check out last month’s infographics.
You can also view all our VIREB infographics by clicking here.
Download Printable Version – October 2025 VIREB Market Report
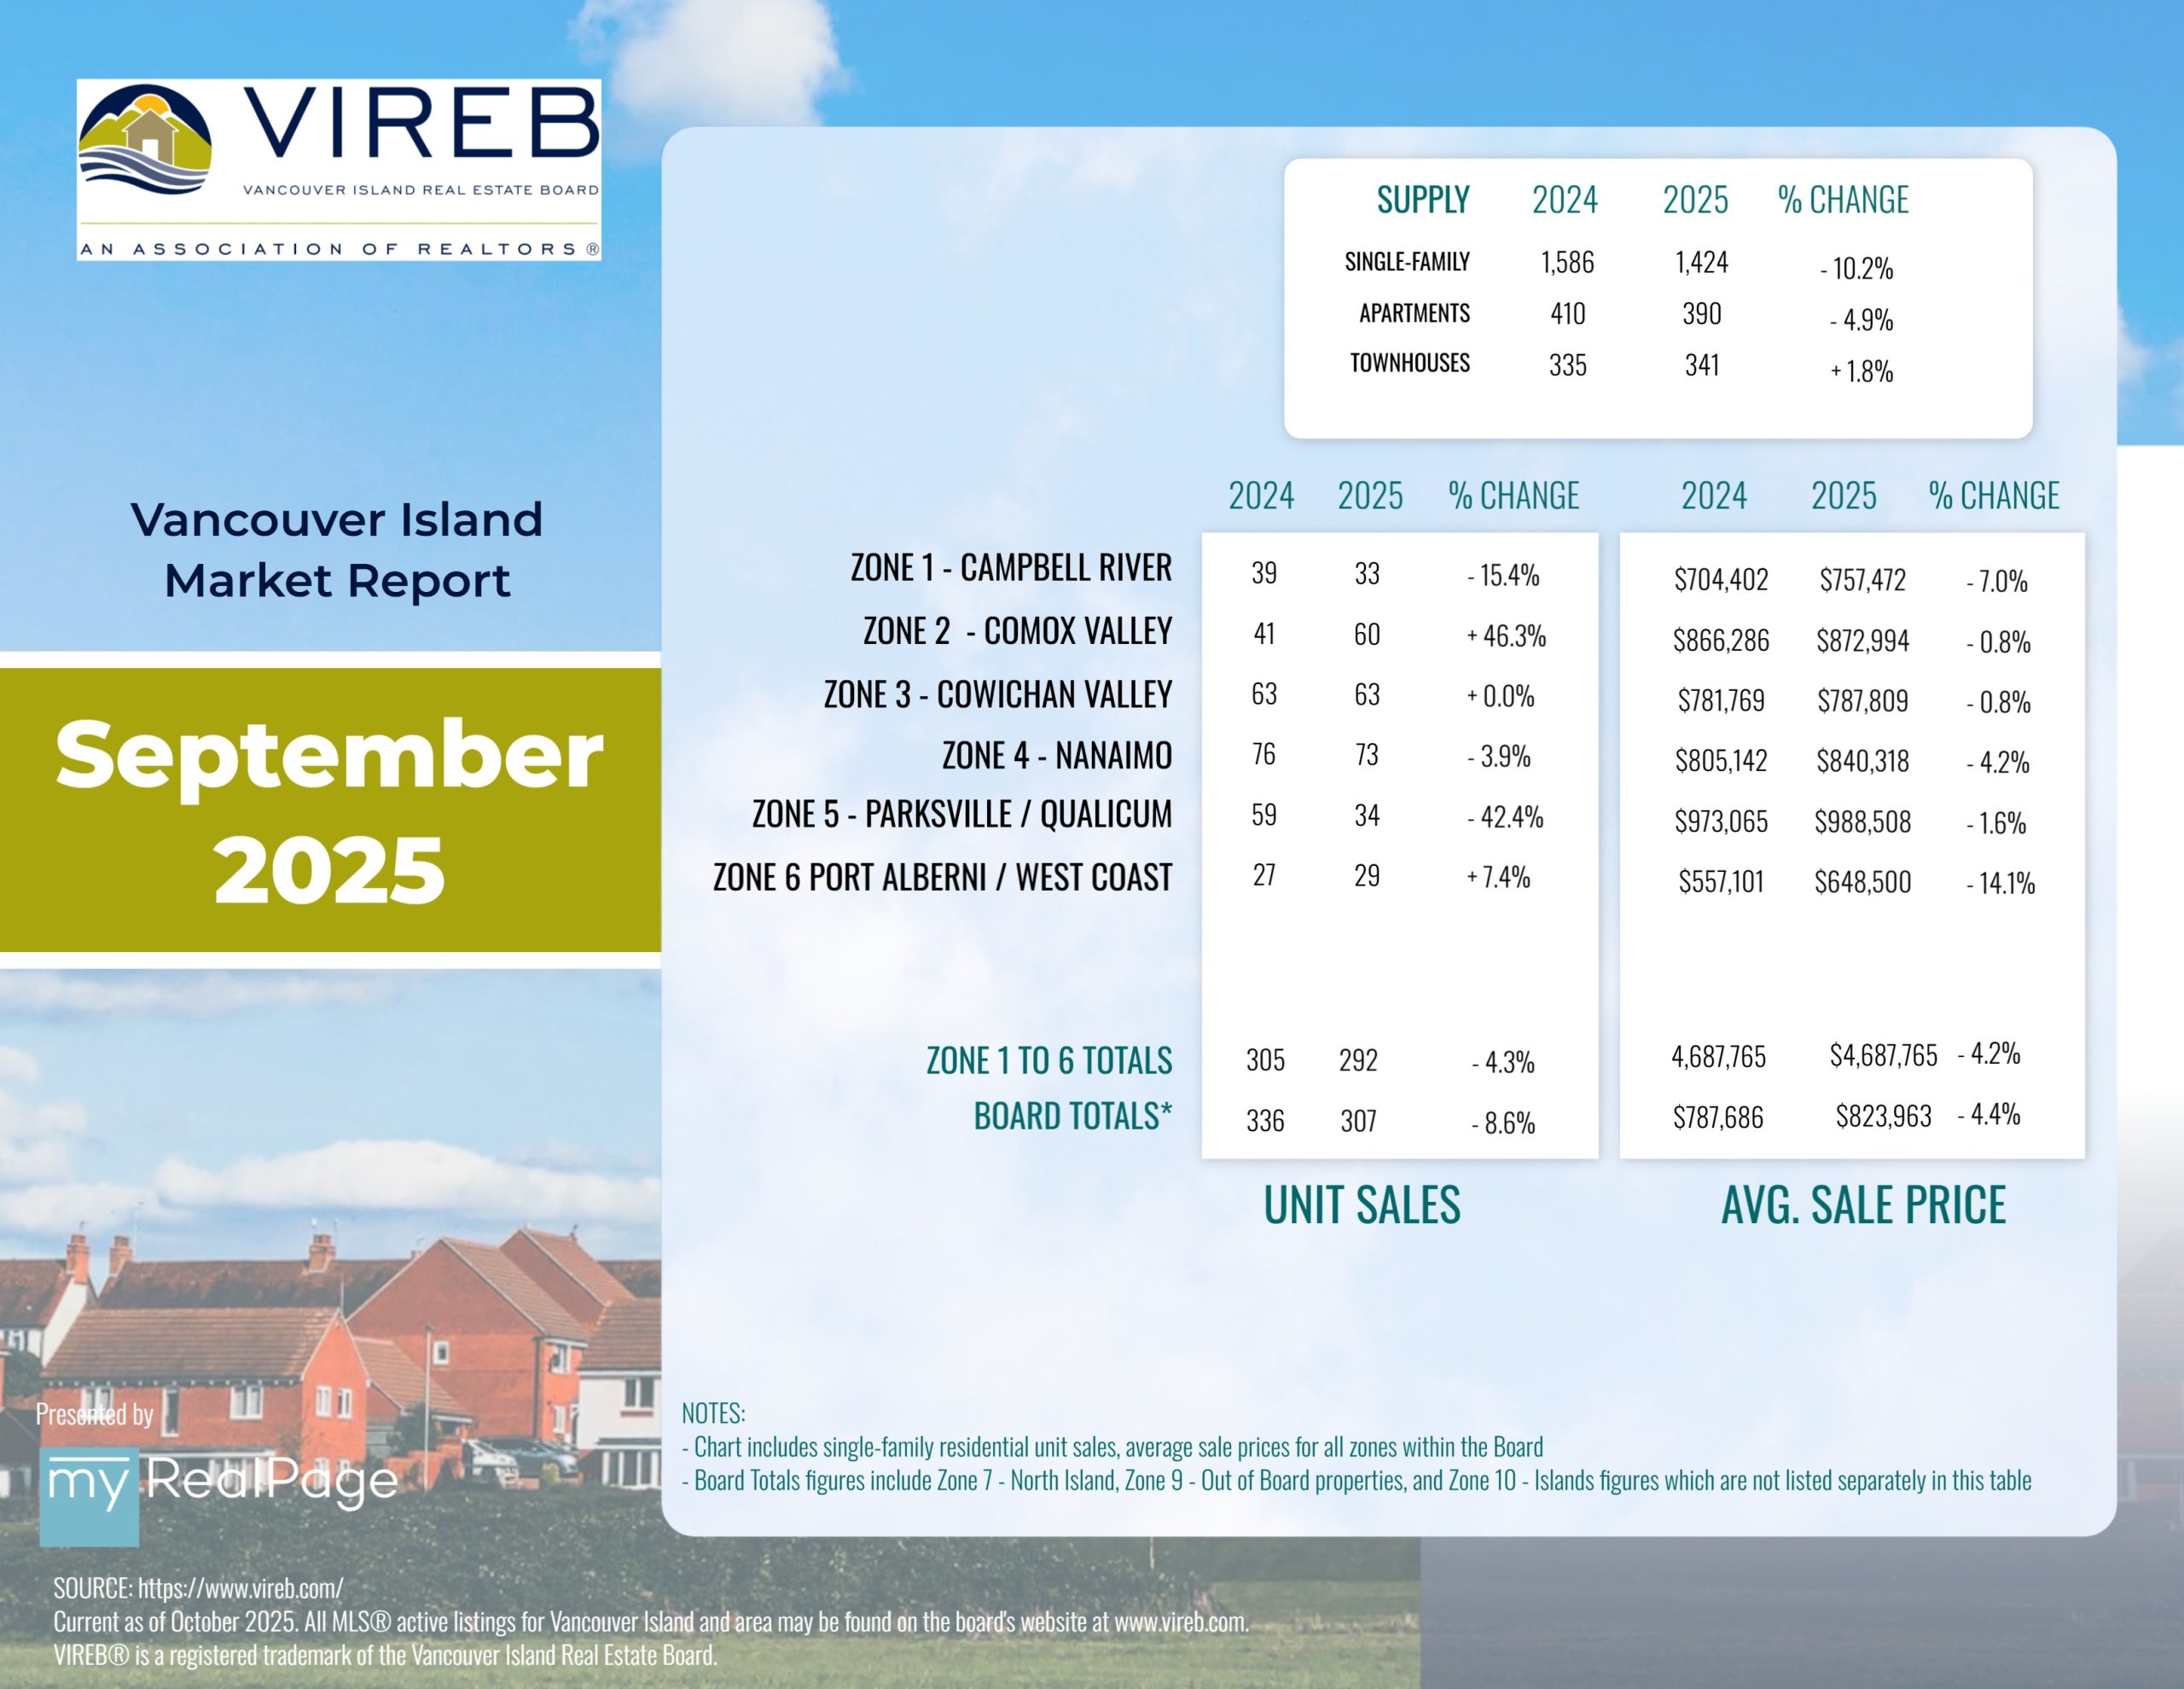
INFOGRAPHICS: September 2025 VIREB Vancouver Island Market Reports
RESILIENT HOUSING MARKET CARRIES VIREB INTO THE FALL
The Vancouver Island Real Estate Board (VIREB) recorded 653 unit sales (all property types) in September 2025, up three per cent from one year ago. Year-over-year active listings (all property types) were 4,293, down four per cent from the previous year.
In the single-family category (excluding acreage and waterfront), 307 homes sold in September, down four per cent from one year ago and nine per cent from August. Sales of condo apartments last month came in at 59, a decrease of 14 per cent year over year and a drop of 20 per cent from August. In the row/townhouse category, 79 units changed hands in September, down 13 per cent from one year ago and up 10 per cent from August.
Active listings of single-family homes were 1,424 last month compared to 1,586 in September 2024. VIREB’s inventory of condo apartments was 390 in September, down from the 410 listings posted one year ago. There were 341 row/townhouses for sale last month compared to 335 in September 2024.
Read the full report on VIREB website!
The following data is a comparison between September 2025 and September 2024 numbers, and is current as of October of 2025. Click here to check out last month’s infographics.
You can also view all our VIREB infographics by clicking here.
Download Printable Version – September 2025 VIREB Market Report
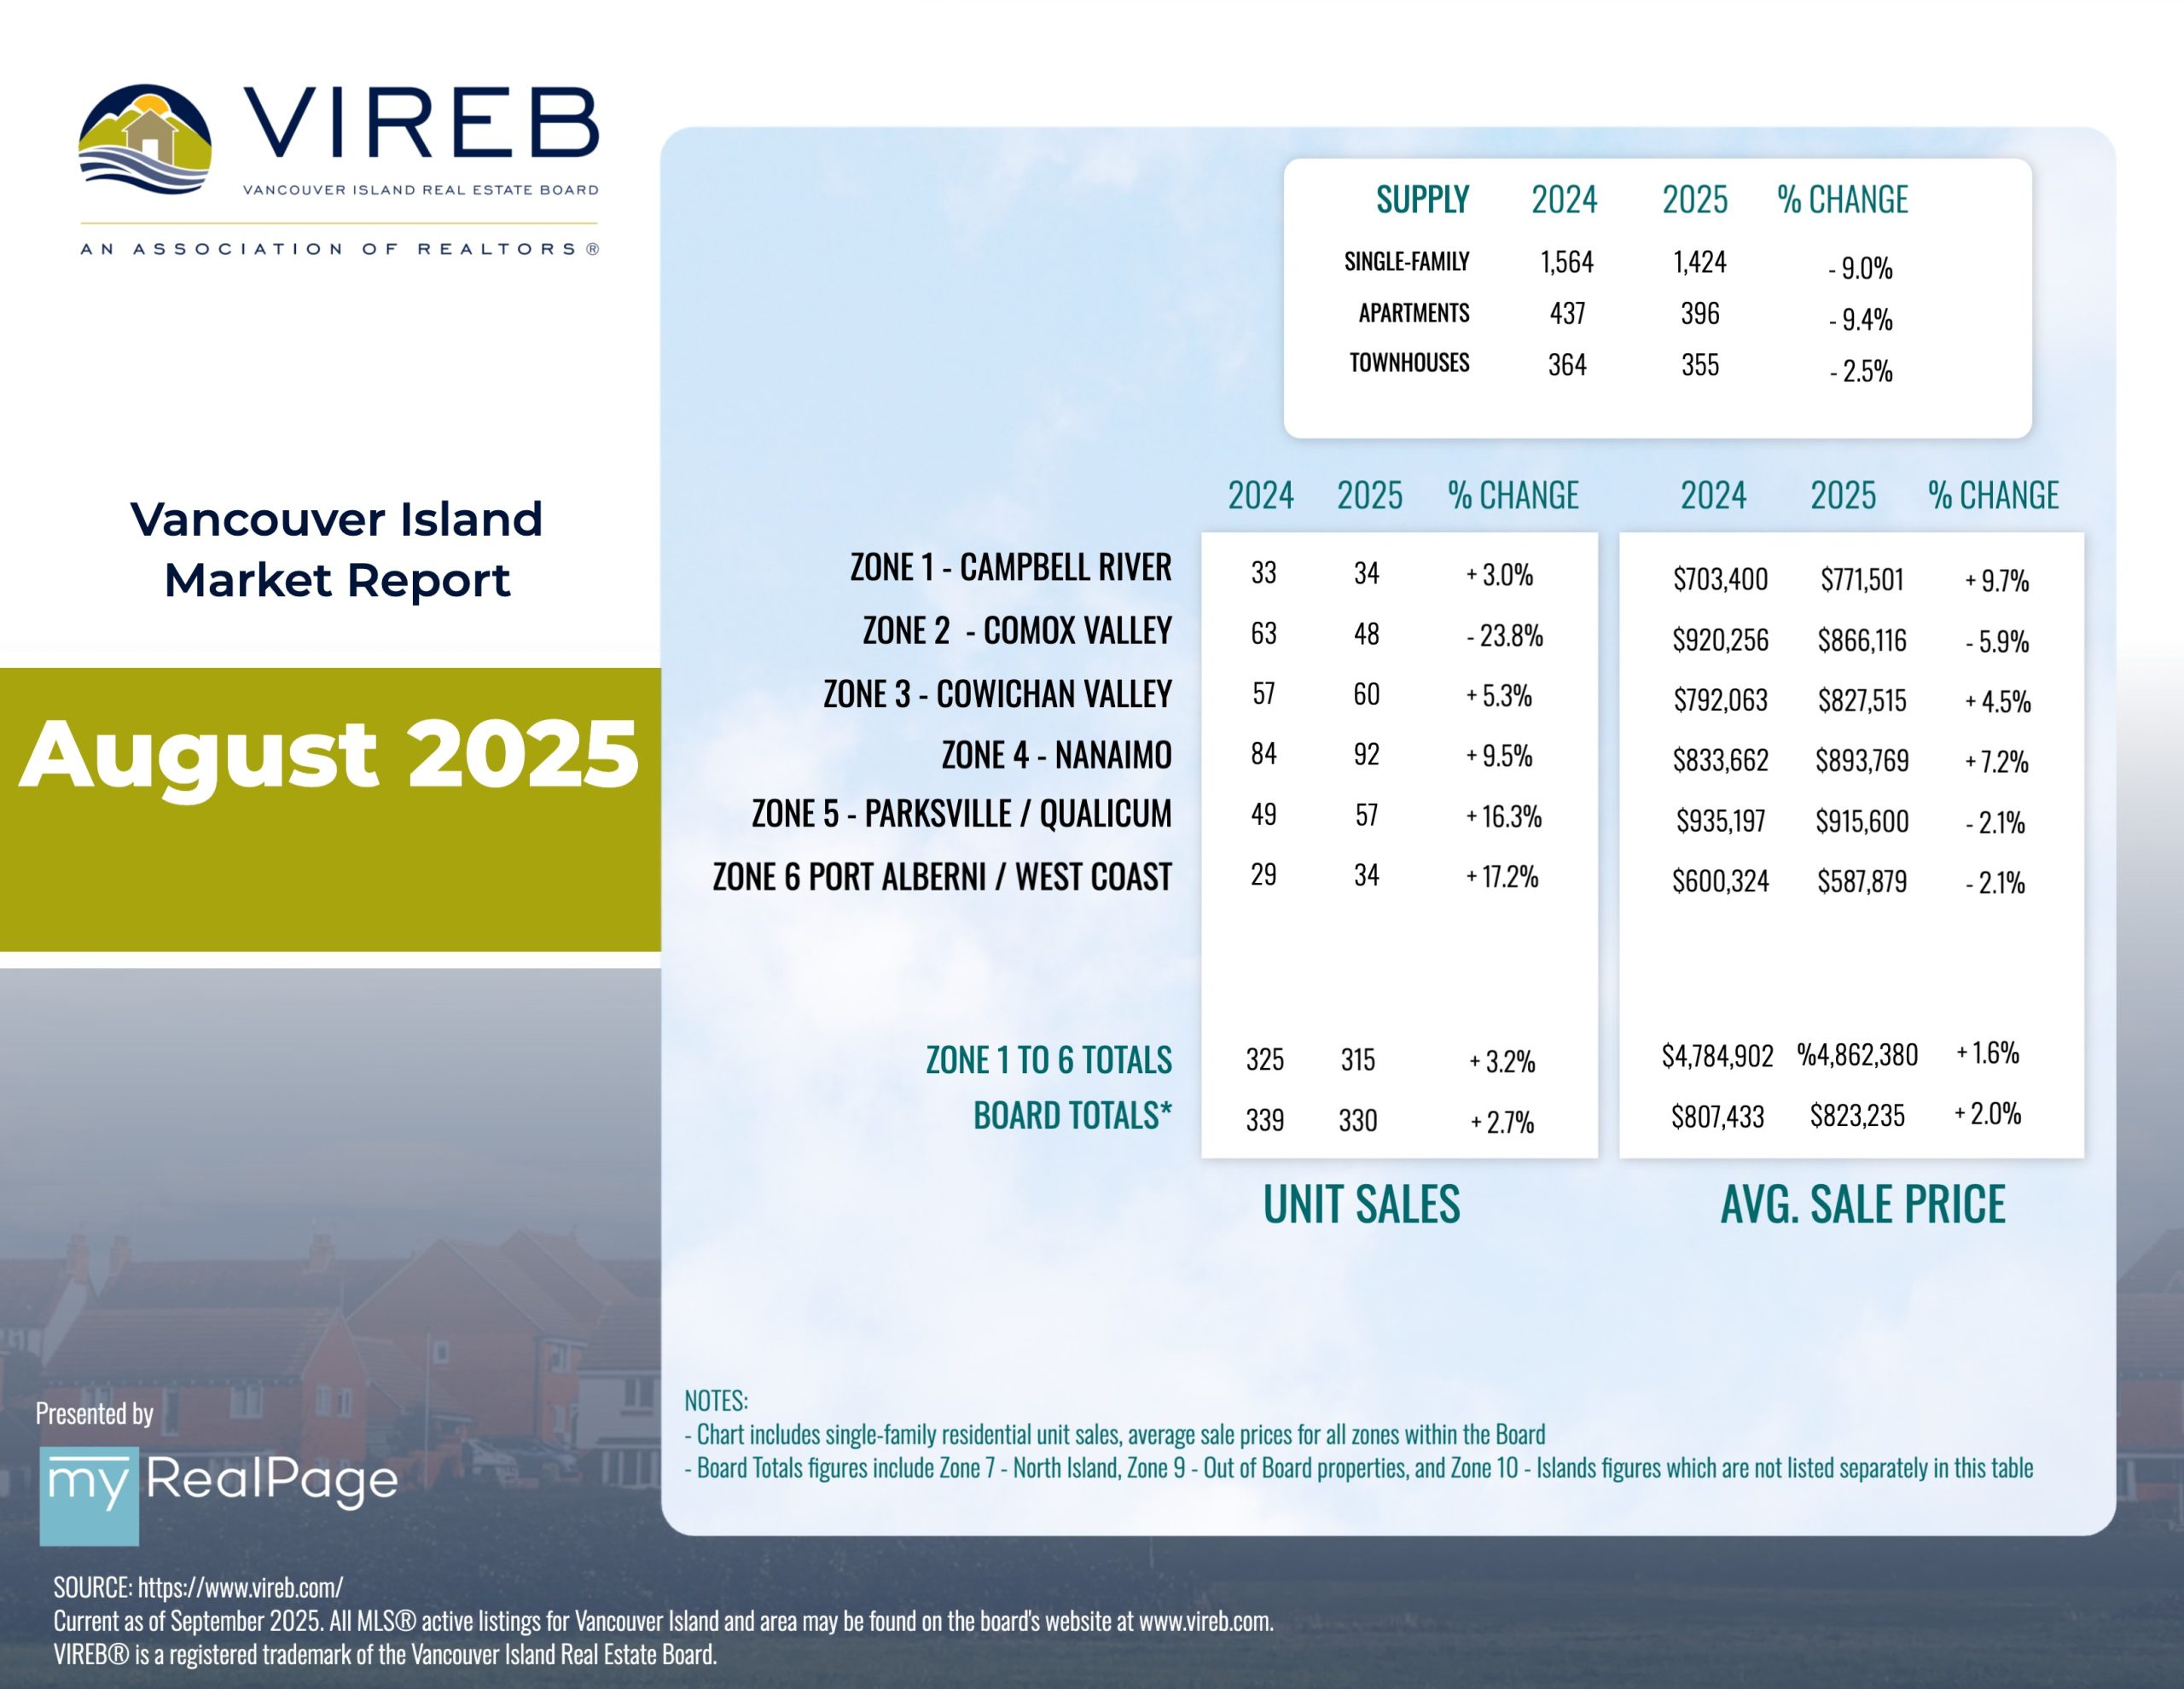
INFOGRAPHICS: August 2025 VIREB Vancouver Island Market Reports
MARKET SLOWER THAN IN JULY BUT STILL AHEAD OF LAST YEAR
The Vancouver Island Real Estate Board (VIREB) recorded 692 unit sales (all property types) in August 2025, up six per cent from one year ago. Year-over-year active listings (all property types) were 4,405, down three per cent from the previous year.
In the single-family category (excluding acreage and waterfront), 339 homes sold in August, up three per cent from one year ago and down 19 per cent from July. Sales of condo apartments last month came in at 74, an increase of nine per cent year over year and up four per cent from July. In the row/townhouse category, 72 units changed hands in August, up four per cent from one year ago and down 24 per cent from July.
Active listings of single-family homes were 1,424 last month compared to 1,564 in August 2024. VIREB’s inventory of condo apartments was 396 in August, down from the 437 listings posted one year ago. There were 355 row/townhouses for sale last month compared to 364 in August 2024. VIREB Chair Olivier Naud notes that VIREB’s housing market is in the mid-range of balanced, with approximately six months of inventory.
“August was slower than July, but that’s typical with back to school on the horizon,” says Naud. “However, sales were up from the previous August, and our market is proving to be resilient. There is pent-up demand but still some hesitancy that we attribute to ongoing tariff concerns.”
Read the full report on VIREB website!
The following data is a comparison between August 2025 and August 2024 numbers, and is current as of September of 2025. Click here to check out last month’s infographics.
You can also view all our VIREB infographics by clicking here.
Download Printable Version – August 2025 VIREB Market Report